E

Maps 🗺 Coding 💻 Dataviz 📈

Chia-Hsien (Andy) Lin

I'm a coder driven by the passion to discover meanings in datasets and communicate them in the most accessible way. Maps are my favorite type of data visualization, and I can spend a whole day clicking around an interactive map.

If you need someone who is familiar with Vue, ES6, D3, Mapbox GL JS or R, feel free to contact me via any of the links below.

  • '21.08 - Financial Times, Data Reporter
  • '19.10 - '20.02The Straits Times, Dataviz Designer
  • '17.02 - '19.09CommonWealth Magazine, Data Journalist
  • '16.08 - '17.01Initium Media, Data Product Manager
  • '15.06 - '16.07The News Lens, Data Editor
  • '13.08 - '15.05Economic Daily News, News Editor
Maps


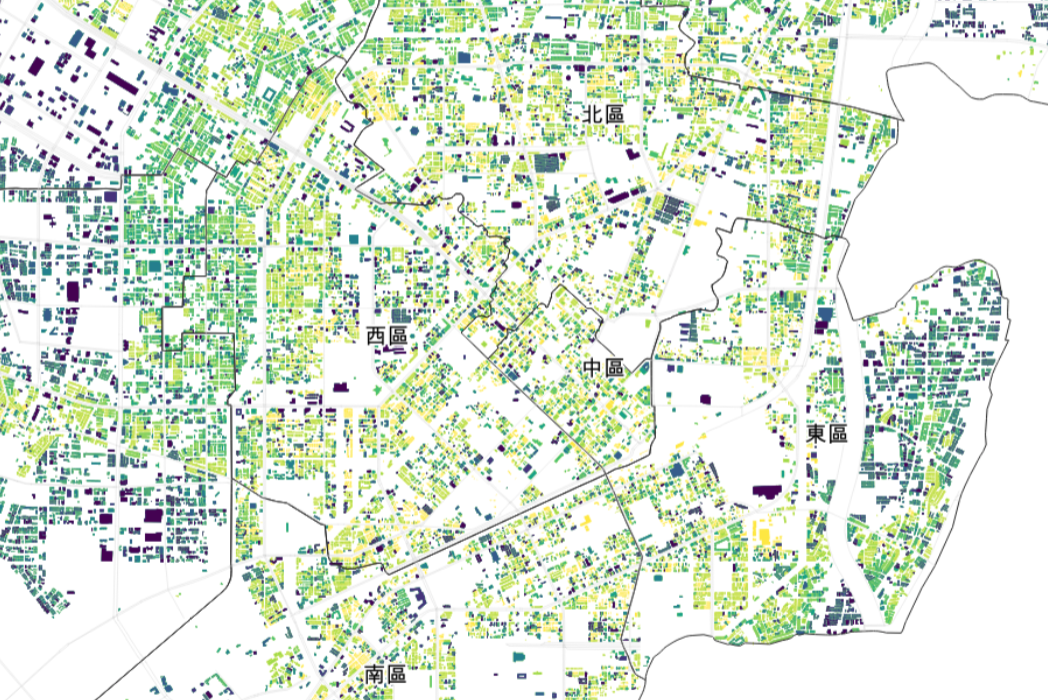
The Age of Every Building in Downtown Taichung

History of Taichung in an interactive map

The Age of Every Building in Downtown Taichung

I scraped the housing information from government sites and made a raster map.

  • Vue: frontend framework for the app
  • Mapbox GL JS: display raster tiles and provide basic interactivities
  • R: geocomputation with sf
The Age of Every Building in Downtown Taichung GitHub

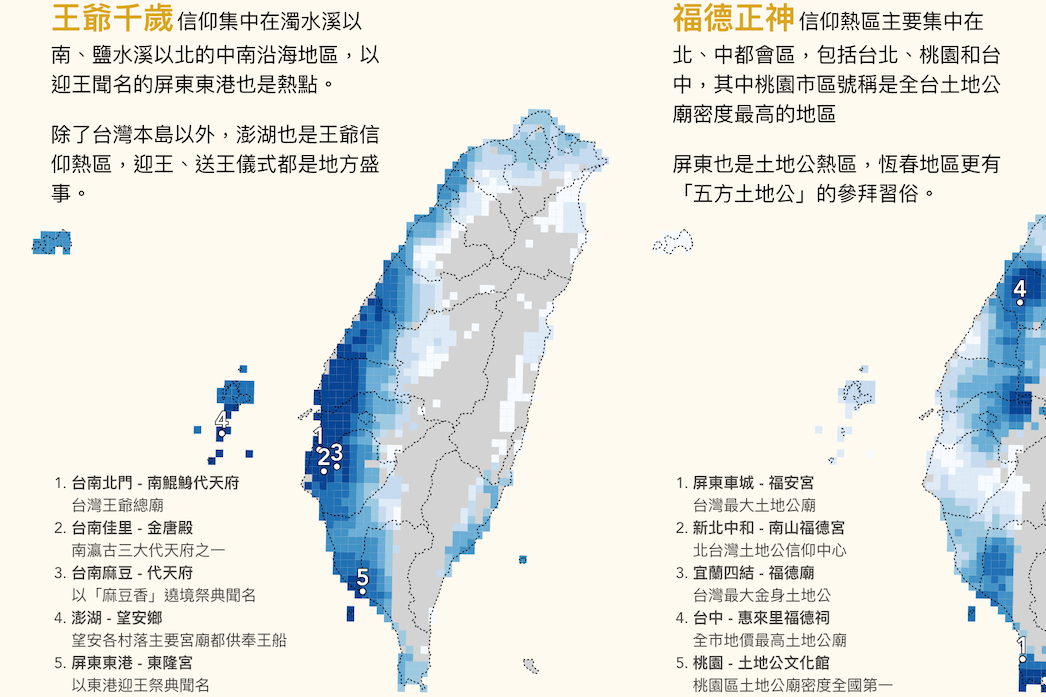
Taiwanese Gods: Deities and Their Turfs

Hotspots of popular deities in Taiwan

Taiwanese Gods: Deities and Their Turfs

I employed exploratory spatial data analysis algorithms to locate hotspots for the ten most popular deities in Taiwan, such as Buddha and Mazu. Then I designed small multiples maps with D3.

  • Vue: frontend framework for the app
  • D3: small multiples maps
  • R: spatial data analysis with sf and spdep
Taiwanese Gods: Deities and Their Turfs GitHub

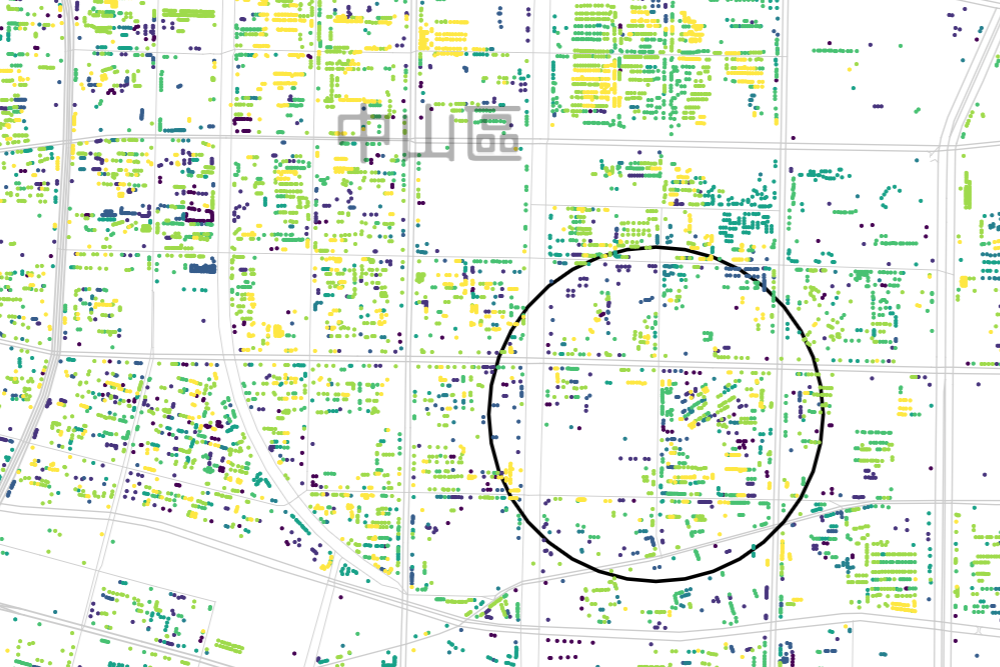
The Age of Every Building in Taipei

History of Taichung in an interactive map

The Age of Every Building in Taipei

I visualized the age of buildings in Taipei in this app. When users move cursors, they can see the average age of buildings in a circle of 500 meters diameter.

  • Turf.js: real-time calculation of average building age
  • Vue: fronted framework for the app
  • Mapbox GL JS: framework for the interactive map
The Age of Every Building in Taipei GitHub

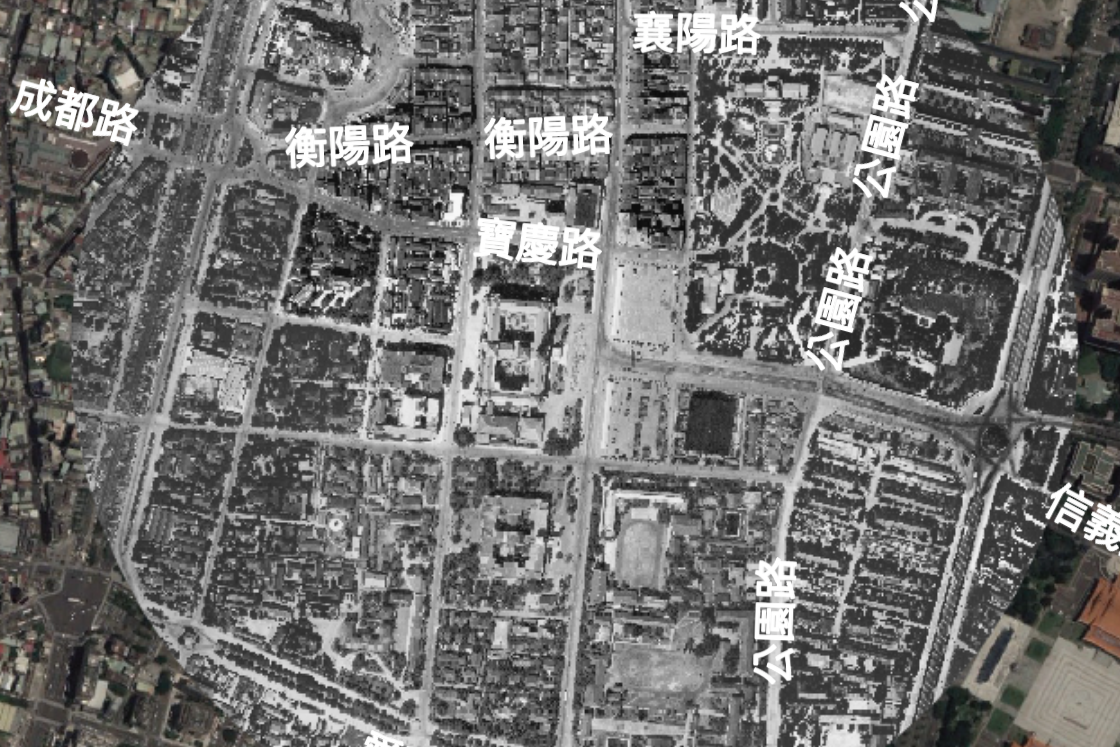
A Lens to the Old Taipei

A combination of aerial and satellite image

A Lens to the Old Taipei

I scraped historical aerial images from a government website and combined them into a large raster map with ImageMagick. Then I used QGIS to export the map as raster tiles and built an map application with OpenLayers.

  • OpenLayers: interactive map and the 'Lens' feature
  • Google Earth Pro: satellite image source
  • ImageMagick: use 'montage' to combine aerial images
A Lens to the Old Taipei GitHub

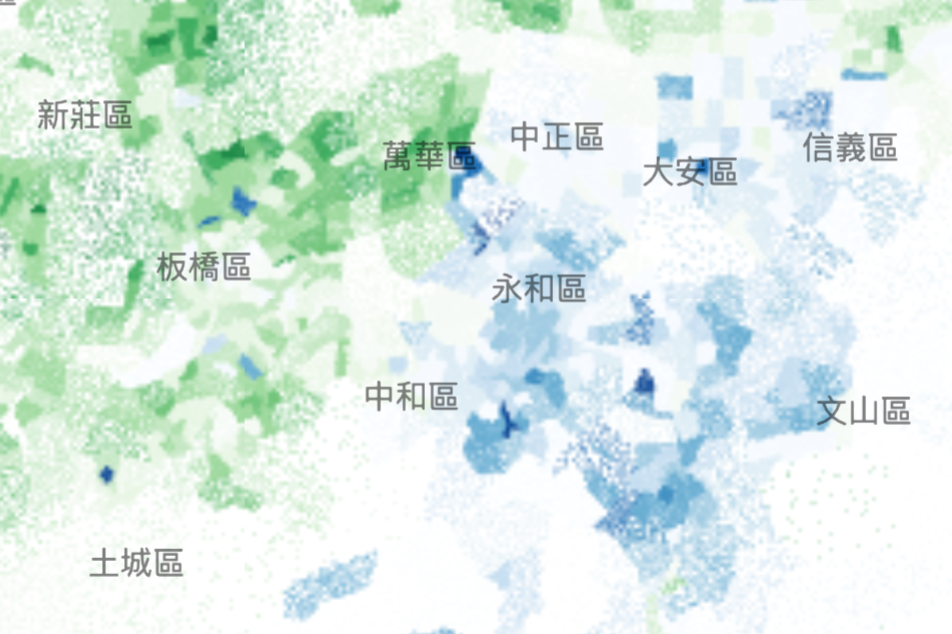
Every Vote Cast in the 2016 Election Visualized

A dot distribution map showing the result of 2016 GE

Every Vote Cast in the 2016 Election Visualized

I simulated the distribution of every vote with QGIS, and export the result in the raster-tile format. Then I built an interactive map with Mapbox GL JS.

  • Mapbox GL JS: framework for the interactive map
  • QGIS: spatial simulation and raster tile processing
  • topojson: simplify geojson files
Every Vote Cast in the 2016 Election Visualized GitHub

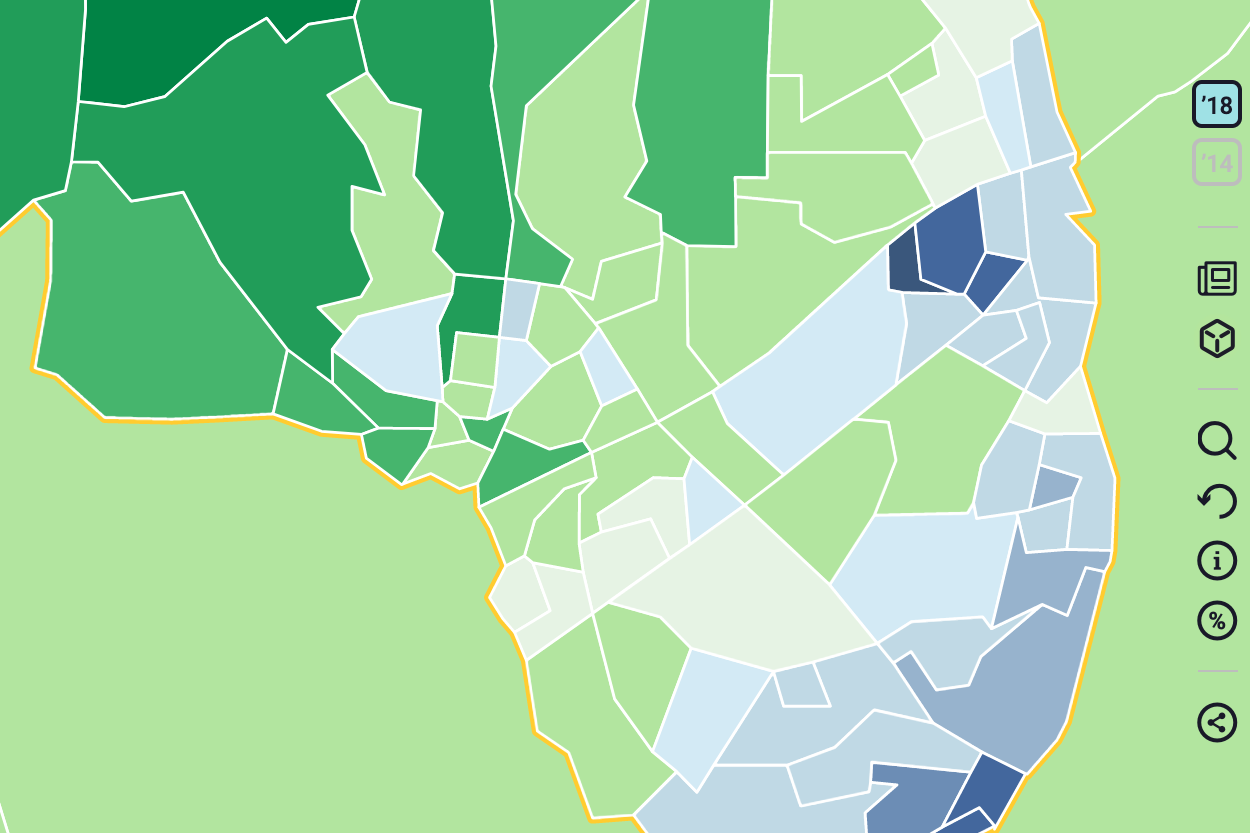
The Result of 2018 Local Election in One Map

An interactive map detaield to the borough-level

The Result of 2018 Local Election in One Map

I built the interactive map with D3js. Users can click on any county/town/borough to zoom in to the specific area. The 'switch-year' feature enables quick comparison of two consecutive election.

  • D3: framework for the interactive map
  • topojson: simplify geojson to improve performance

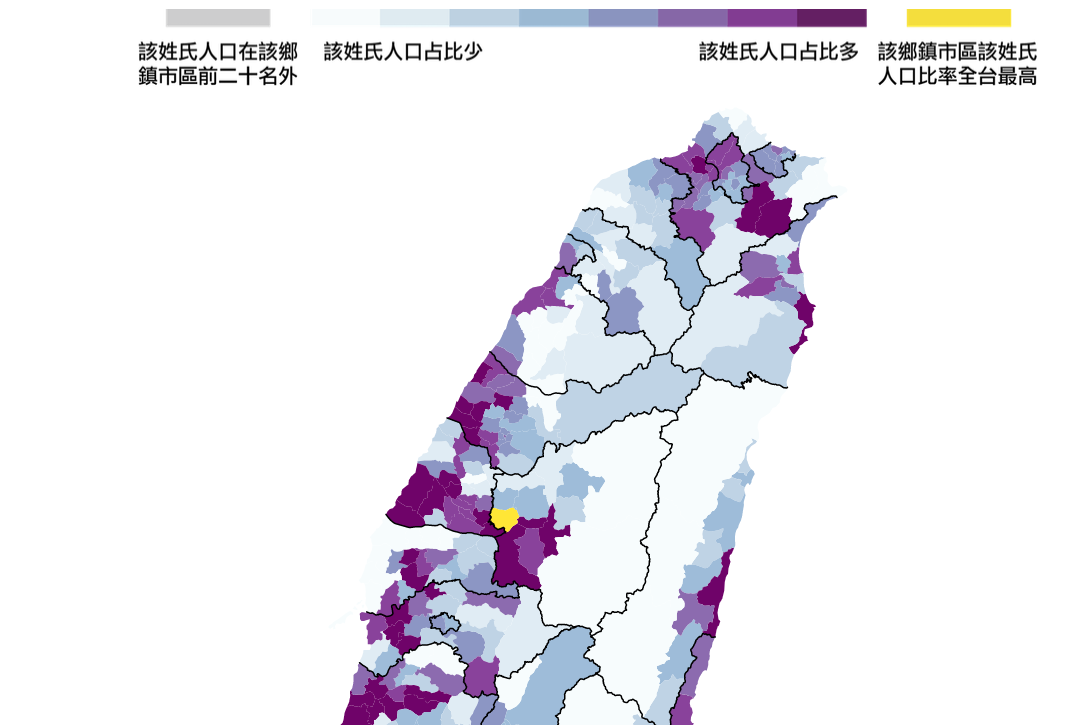
Where Do People with the Same family Name as Yours live?

The distribution of family names in Taiwan

Where Do People with the Same family Name as Yours live?

I visualized the distribution of major family names in Taiwan. Users can choose their family name of interest and read the choropleth for the family name.

  • D3: framework for the visualzation
  • R: data preprocessing
Where Do People with the Same family Name as Yours live? GitHub

Dataviz


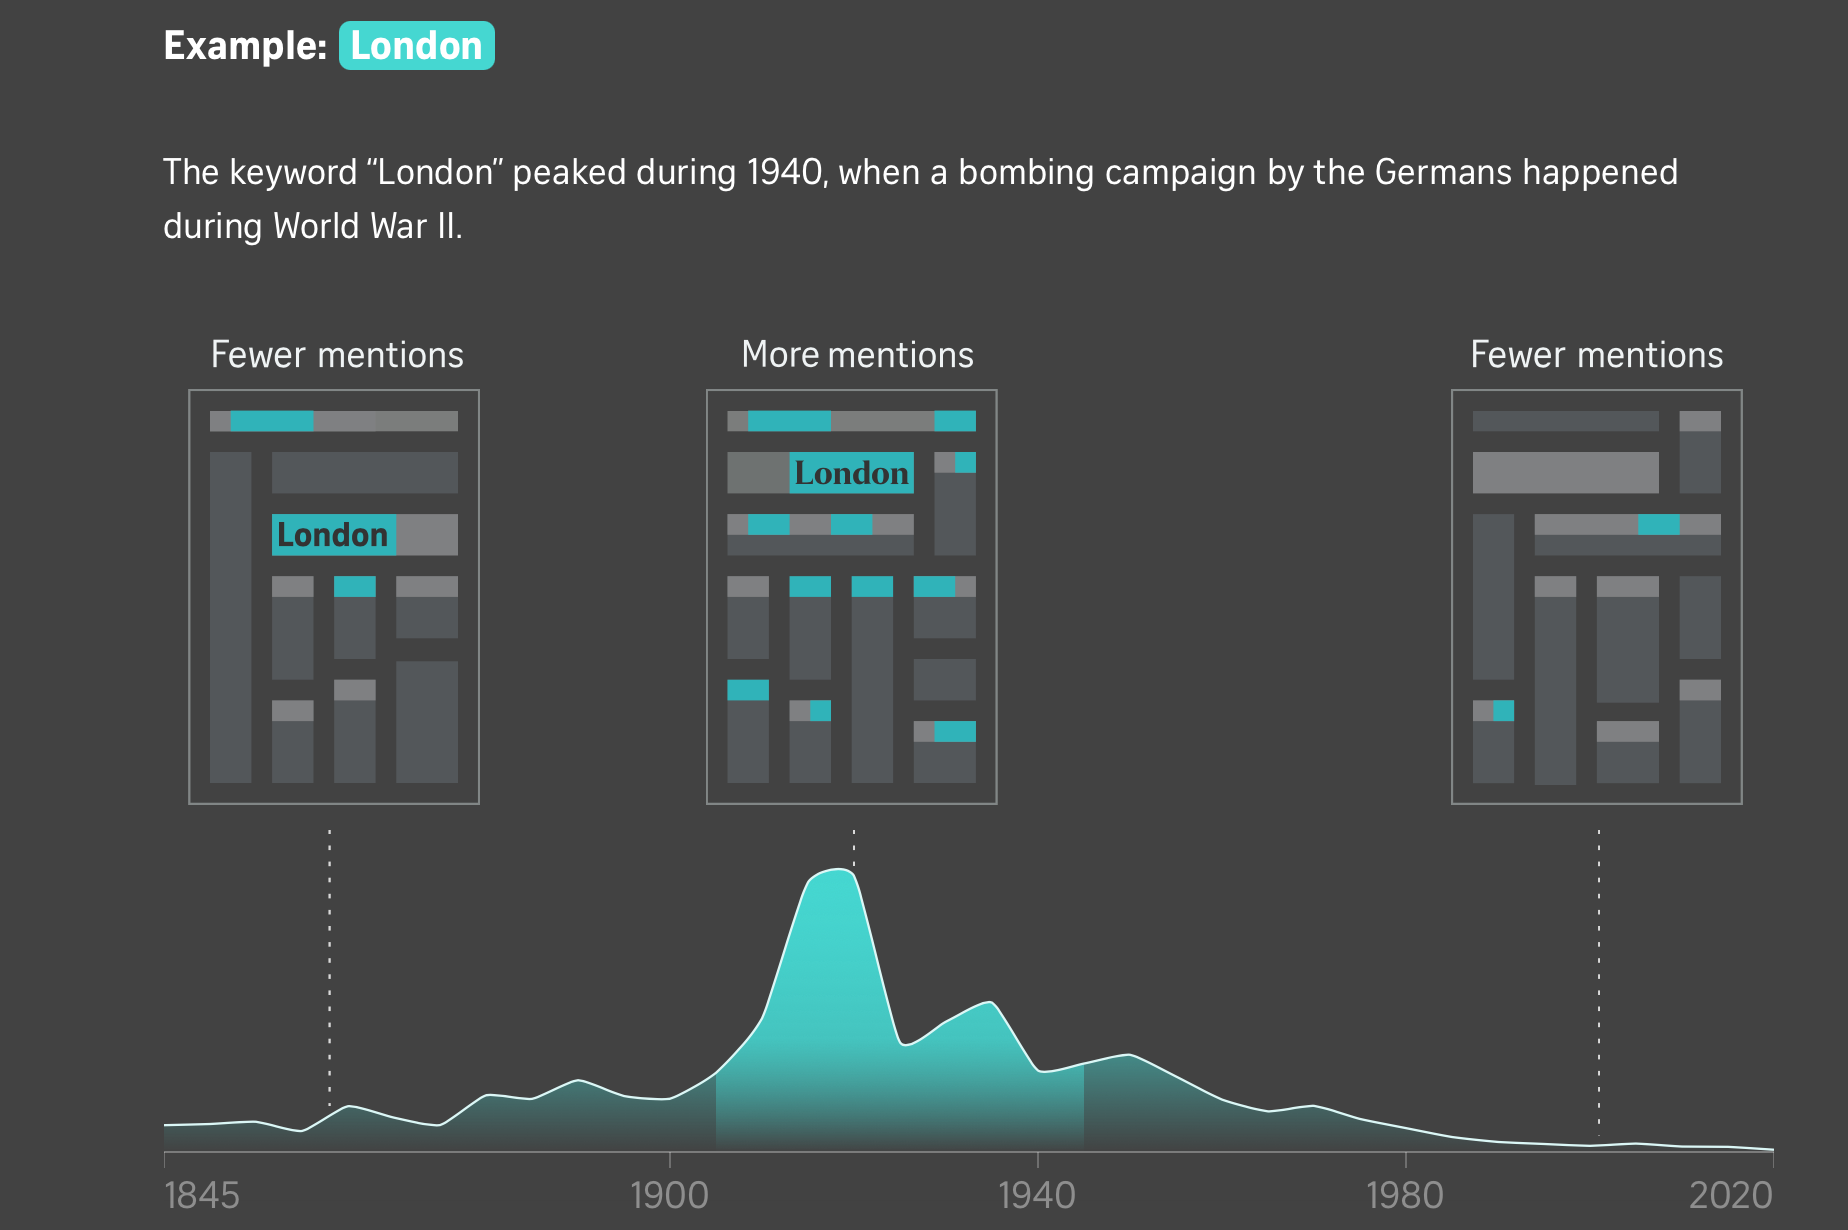
175 Years of The Straits Times’ Headlines

Use text analysis to uncover stories in Singaporean history

175 Years of The Straits Times’ Headlines

I used quantitative text analysis methods to analyze 47,000 headlines and uncover interesting topics and trends such as epidemics, foreign affairs, and vices & crimes. I also designed the overall visual format and interactive flow.

  • R: data cleaning and quantitative text analysis
  • Vue: framework for the app
  • D3: framework for the interactives

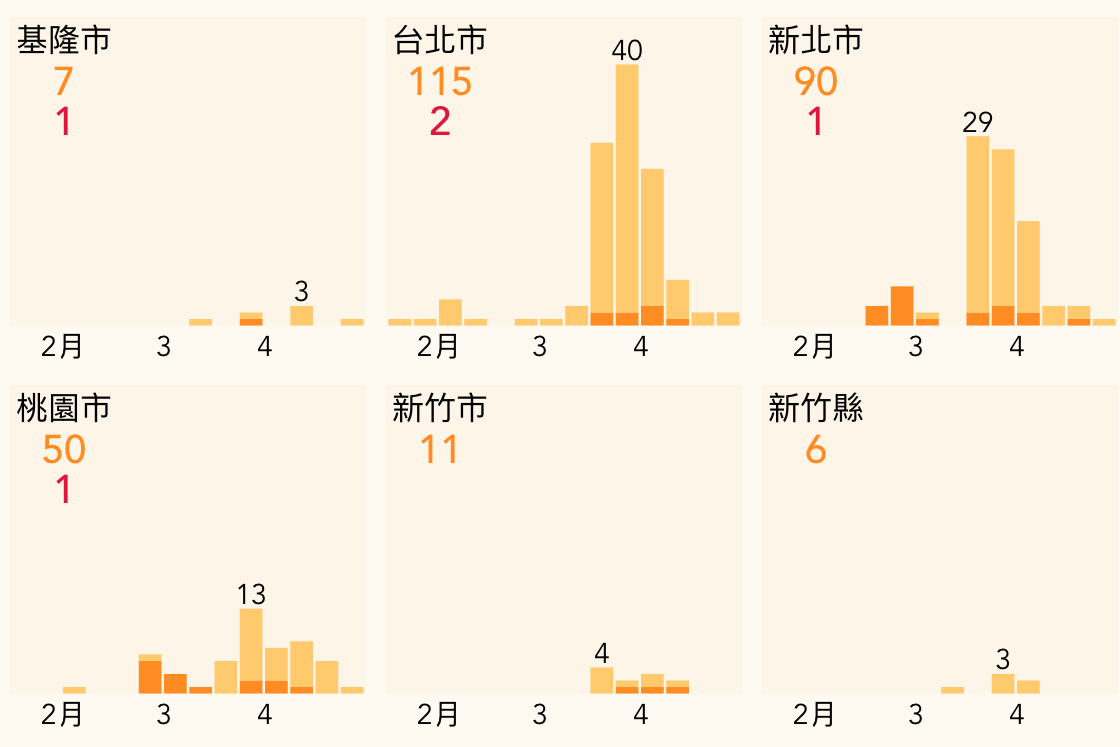
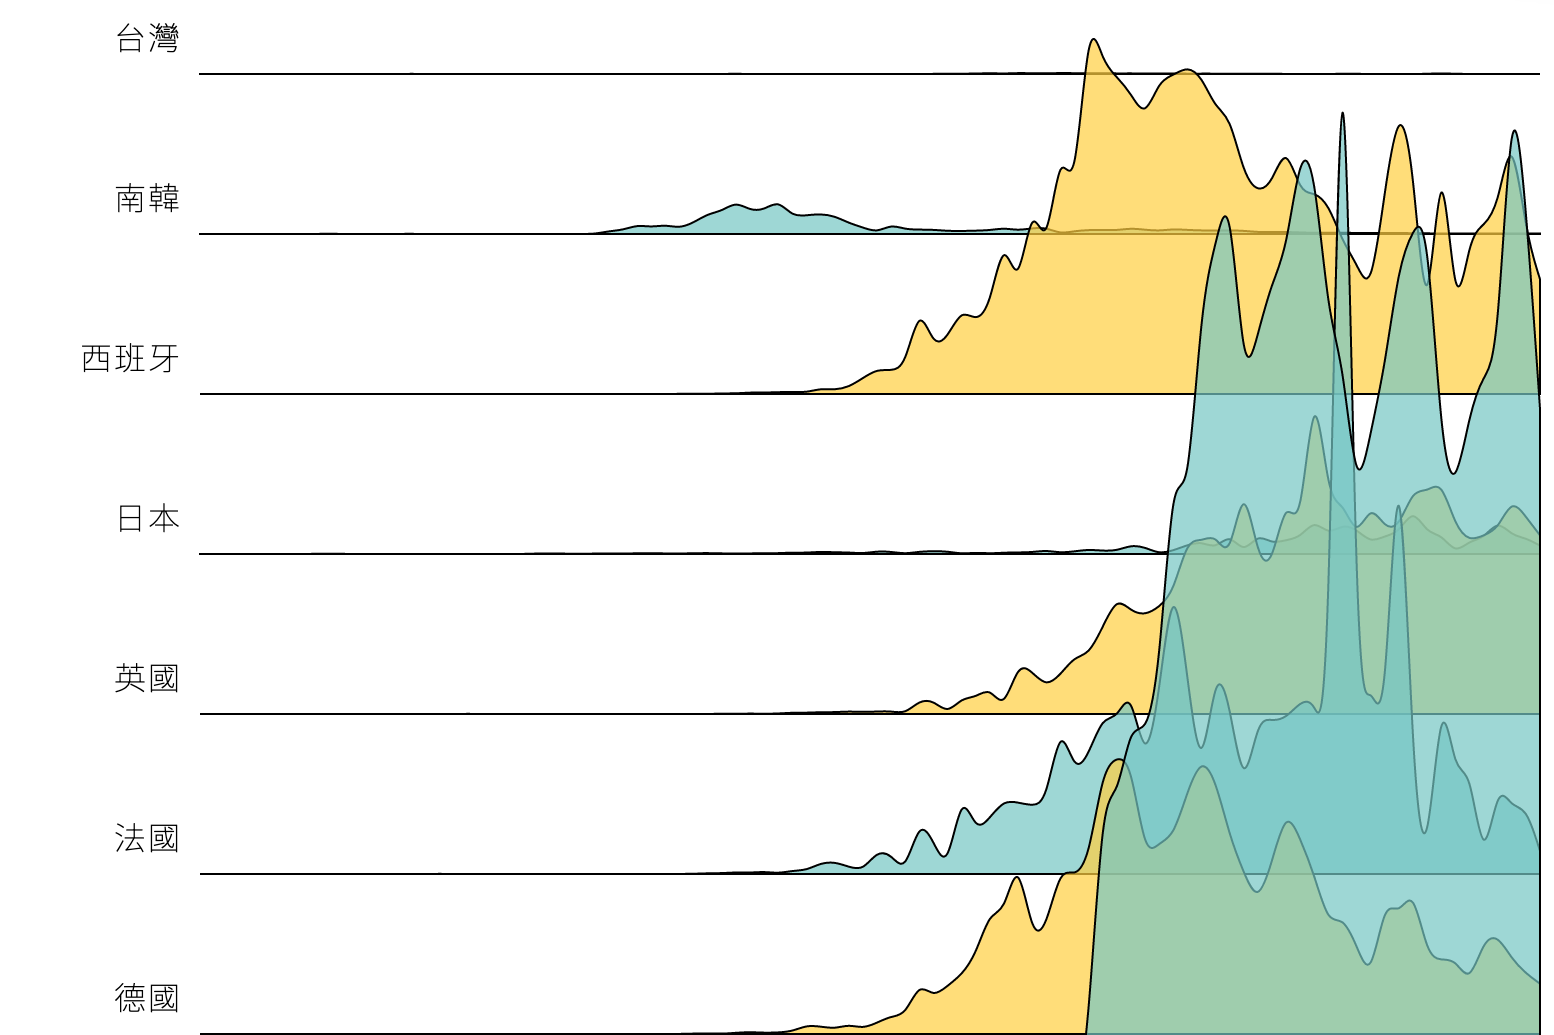
New Cases of Covid-19 in Every County in Taiwan

Display the Covid-19 data in a visual-appealing way

New Cases of Covid-19 in Every County in Taiwan

I built this dashboard with the aim of preserving the relative geographical position of every county in Taiwan. The mobile layout is different from the desktop one for better user experience.

  • Vue: framework for the app
  • D3: draw stacked barcharts
New Cases of Covid-19 in Every County in Taiwan GitHub

Do You Know who are Elected as MPs this Time?

Know the newly elected MPs with a scroller

Do You Know who are Elected as MPs this Time?

I built a scroller to show how many newly elected MPs are female, are new faces in the parliament, or relatively young in the cohort of experienced legislators.

  • D3: force-layout
  • scrollama: scroller effect
  • ImageMagick: thumbnail processing
  • R: MP information scraper
Do You Know who are Elected as MPs this Time? GitHub

Covid-19 in Ten Charts

Dashboard for the latest Covid-19 pandemic situation

Covid-19 in Ten Charts

I built a simple backend for the JHU Covid-19 data and connected it to the frontend visualization page to make it update automatically. The visualization was done using D3.

  • D3: data visualization
  • Google Apps Script: simple apis for the backend
  • Node: backend for the app

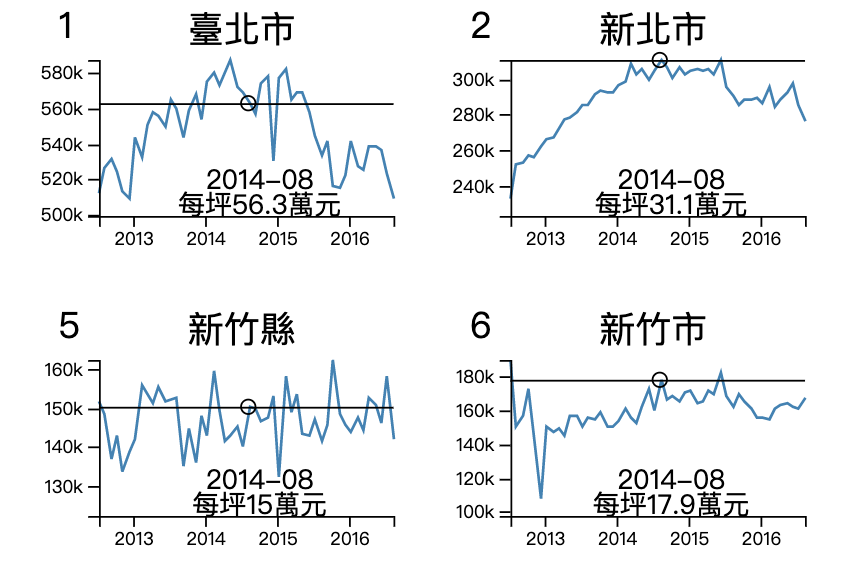
Housing Prices in Every County

Sortable line chart displaying trends in housing markets

Housing Prices in Every County

These small multiples were drawn with D3js. Users can move their cursors on any of the charts to see details of each chart, and choose between three modes of chart arrangement.

  • D3: data visualization
  • R: data scraping, cleaning and wrangling